Creating a Date Dimension Table in Power BI
Problem
How can we create a date dimension table in Power BI? We need data such as month name, year, financial quarter, etc. Also, how can we access this data directly with DAX?
Solution
A date dimension is an integral part of a data warehouse. A date dimension will have a range of dates with attributes such as Month Name, Year, Financial Quarter, Financial Semester and Financial Year.
In this tip, I will detail a method to create a Date Dimension in Power BI.
Solution Overview
In this approach, I will make use of a Power BI calculated table to generate date values. Also I will be adding attributes such as Month Name, Financial Year, Financial Semester and Financial Quarter with the help of DAX.
Calculated Tables
In a calculated table, the table values are generated by Data Analysis Expression (DAX) and the values are stored in the Power BI model.
DAX Calendar Function
The calendar function returns a table with a single column that contains a continuous set of dates. The start and end date range will be supplied as parameters.
The following formula returns a calculated table with dates between January 1st, 2005 and December 31st, 2015.
=CALENDAR (DATE (2005, 1, 1), DATE (2015, 12, 31))
Creating Date Dimension Calculated table
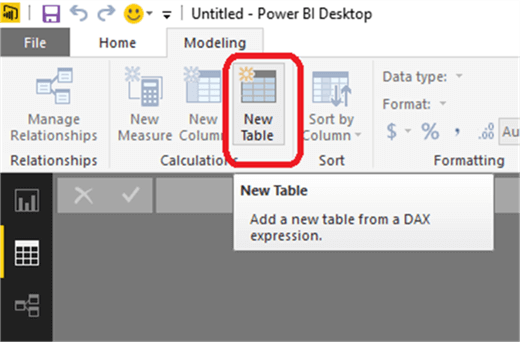
In the Power BI desktop application, let’s create a new table.
Once the table has been created, now let’s add the DAX expression to generate desirable date values. I will be using the Calendar function to generate date values. In this example, I will be creating date values between 1st January 2015 and 31st December 2020.
=CALENDAR (DATE (2015, 1, 1), DATE (2020, 12, 31))
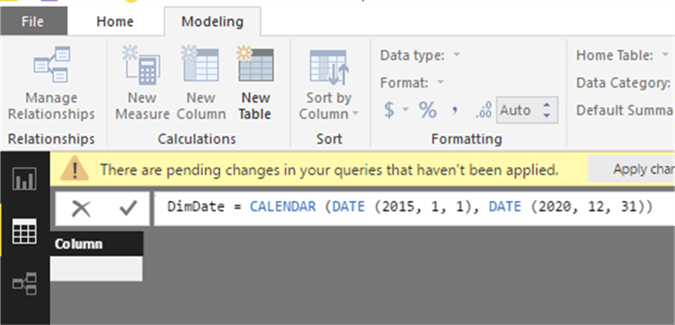
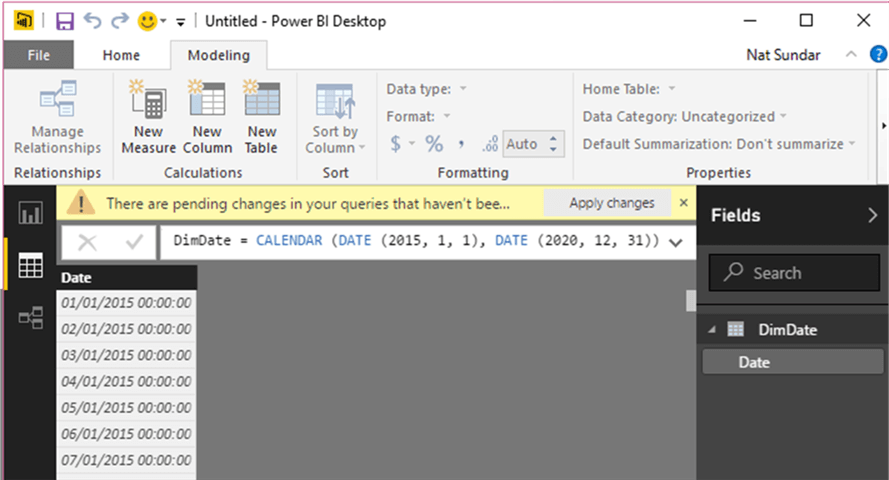
This function accepts start and end dates as parameters. I have provided the start and end date as “01/01/2015” and “31/12/2020”. Once updated, the Power BI will generate the date values in the query.
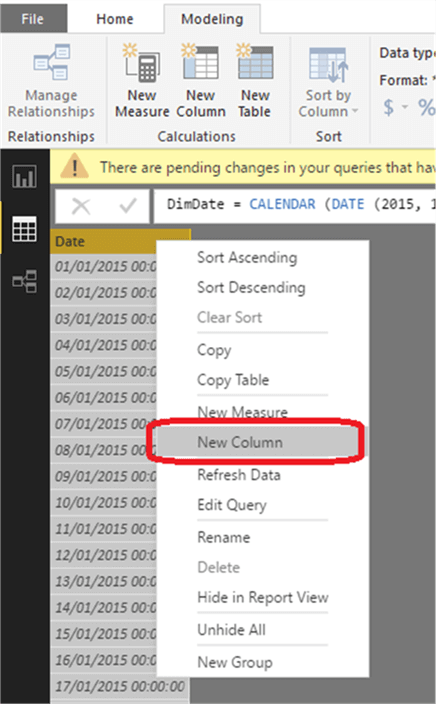
Adding Attributes to Date Dimension
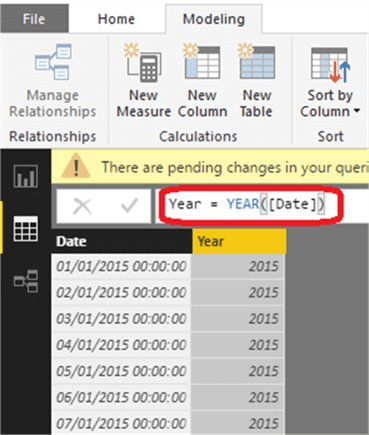
Let’s add a year attribute to the table and the DAX expression to calculate the year which is “Year([Date])”.
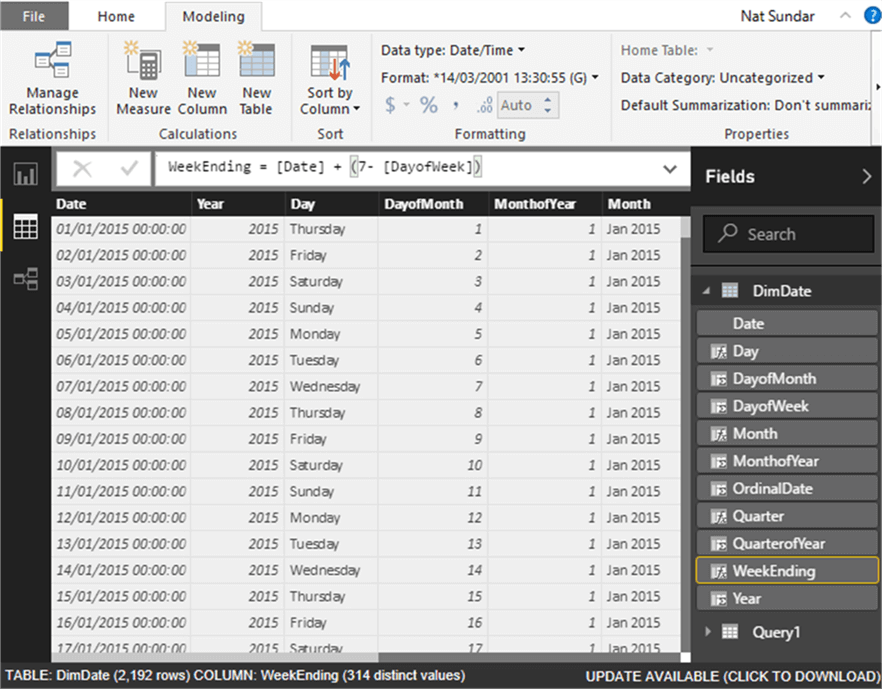
As above, now let’s add more attributes to the calculated table. I have provided the DAX expression for each attribute below.
Year = YEAR([Date])

Day = Format([Date],"DDDD")

DayofMonth = DAY([Date])

MonthofYear = MONTH([Date])

Month = FORMAT([Date], "MMM") & " " & [Year]

QuarterofYear = ROUNDUP (MONTH([Date])/3,0)

Quarter = "Q" & [QuarterofYear] & " " & [Year]

OrdinalDate = DATEDIFF([Year]&",1,1",[Date],DAY)+1

DayofWeek = WEEKDAY([Date],2)

WeekEnding = [Date] + (7- [DayofWeek])
The fully extended DateDimension table can be found below.
Summary
The data in the calculated table is self-contained and source independent. Based on the configuration of start and end date, the date range can be extended easily. Hence this approach is ideal for reporting and analysis purposes.
Next Steps
- Read more about the calendar function.
- Read other Power BI Tips here.


Comments
Post a Comment